Spring Cloud Turbine介绍
在复杂的分布式系统中,相同服务的节点经常需要部署上百甚至上千个,很多时候,运维人员希望能够把相同服务的节点状态以一个整体集群的形式展现出来,这样可以更好的把握整个系统的状态。 为此,Netflix提供了一个开源项目(Turbine)来提供把多个hystrix.stream的内容聚合为一个数据源供Dashboard展示。
监测接口(仪表盘)
加入仪表盘
紧接上一篇,加入仪表盘,ribbon和feign中同时加入。
pom文件
<!--暴露各种指标-->
 <dependency>
     <groupId>org.springframework.boot</groupId>
     <artifactId>spring-boot-starter-actuator</artifactId>
 </dependency>
 <dependency>
     <groupId>com.netflix.hystrix</groupId>
     <artifactId>hystrix-javanica</artifactId>
     <version>RELEASE</version>
 </dependency>
 <dependency>
     <groupId>org.springframework.cloud</groupId>
     <artifactId>spring-cloud-netflix-hystrix-dashboard</artifactId>
 </dependency>
yml配置
management:
  endpoints:
    web:
      exposure:
        include: 'hystrix.stream'
启动类
加入注解
@EnableHystrix
@EnableHystrixDashboard
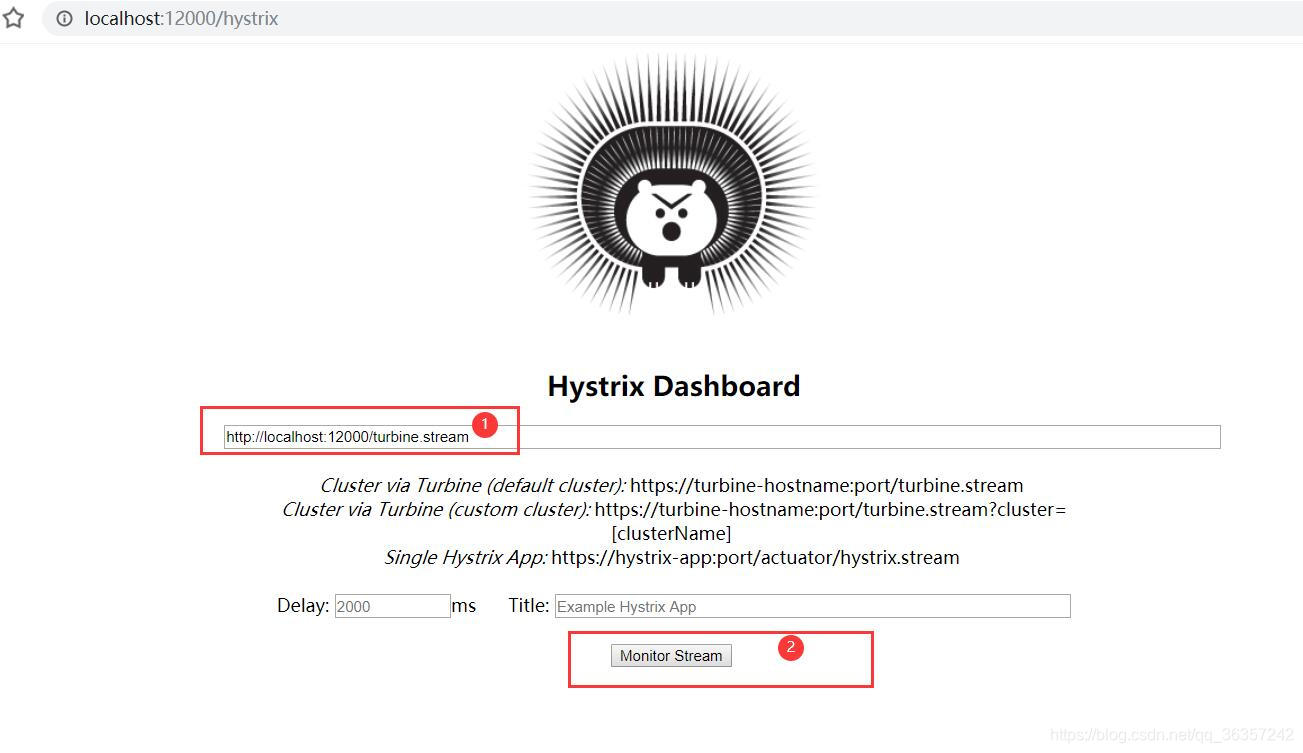
启动访问
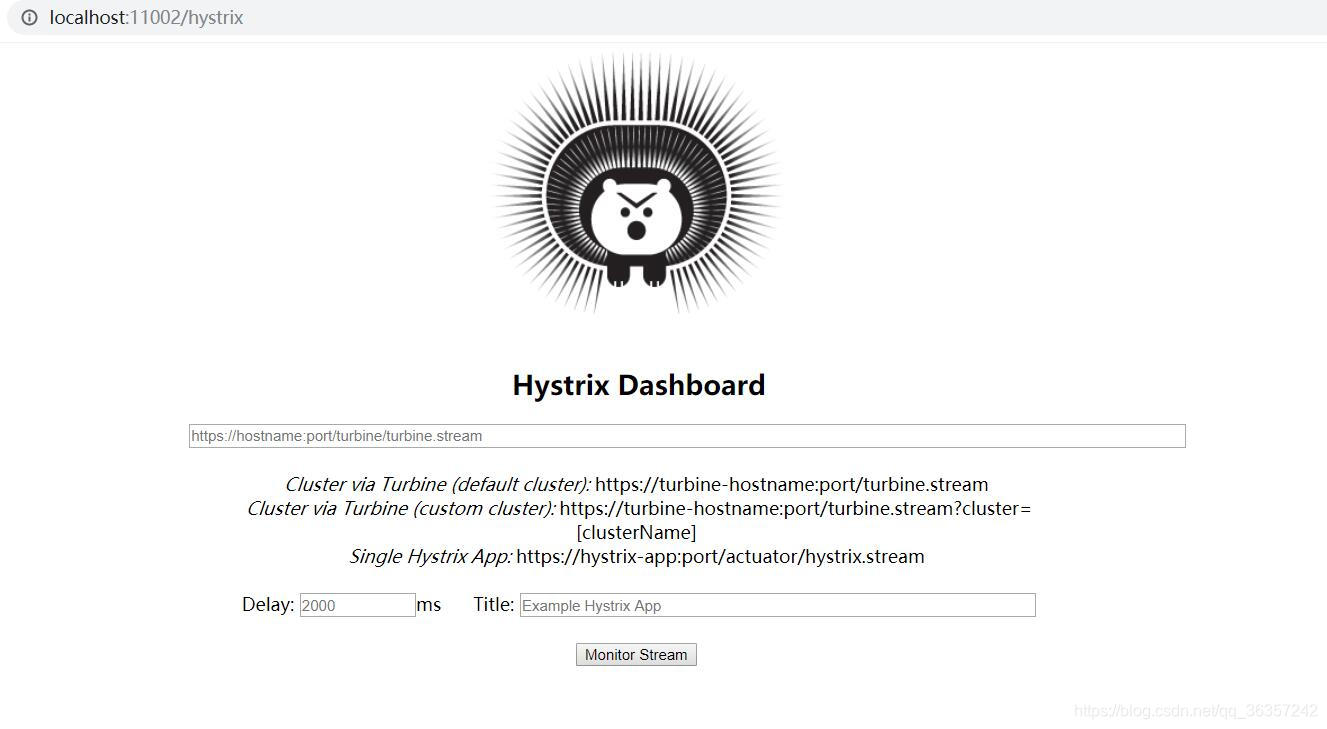
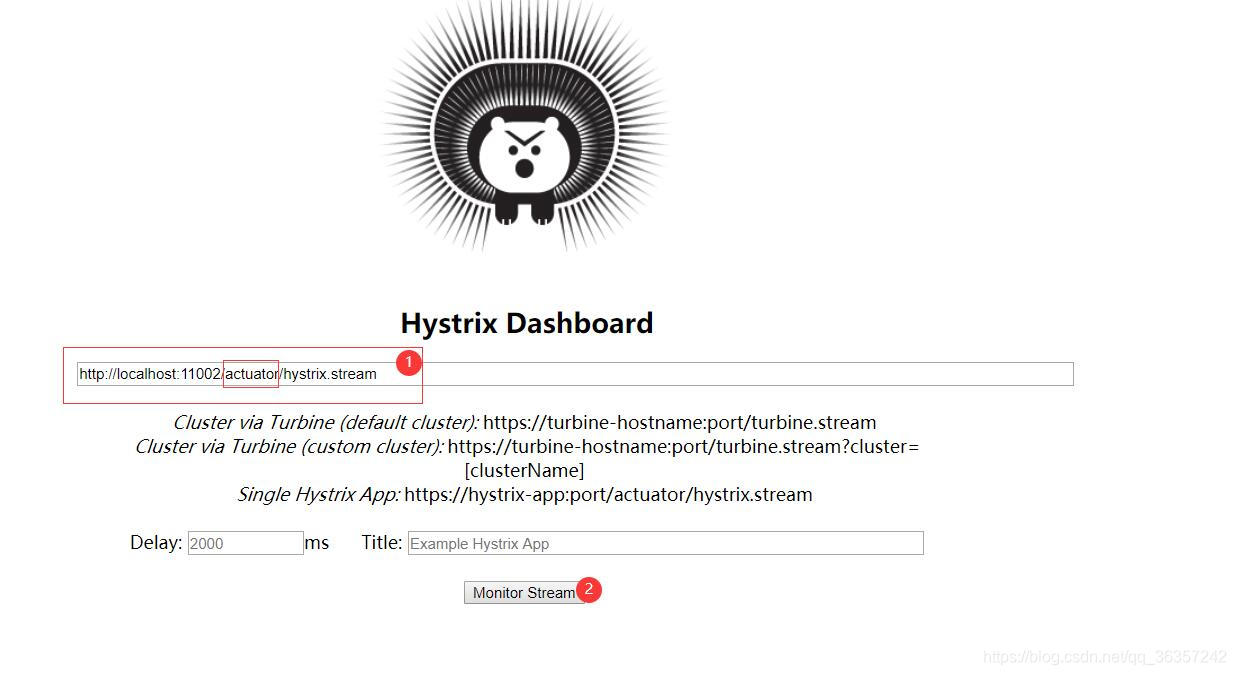
效果为
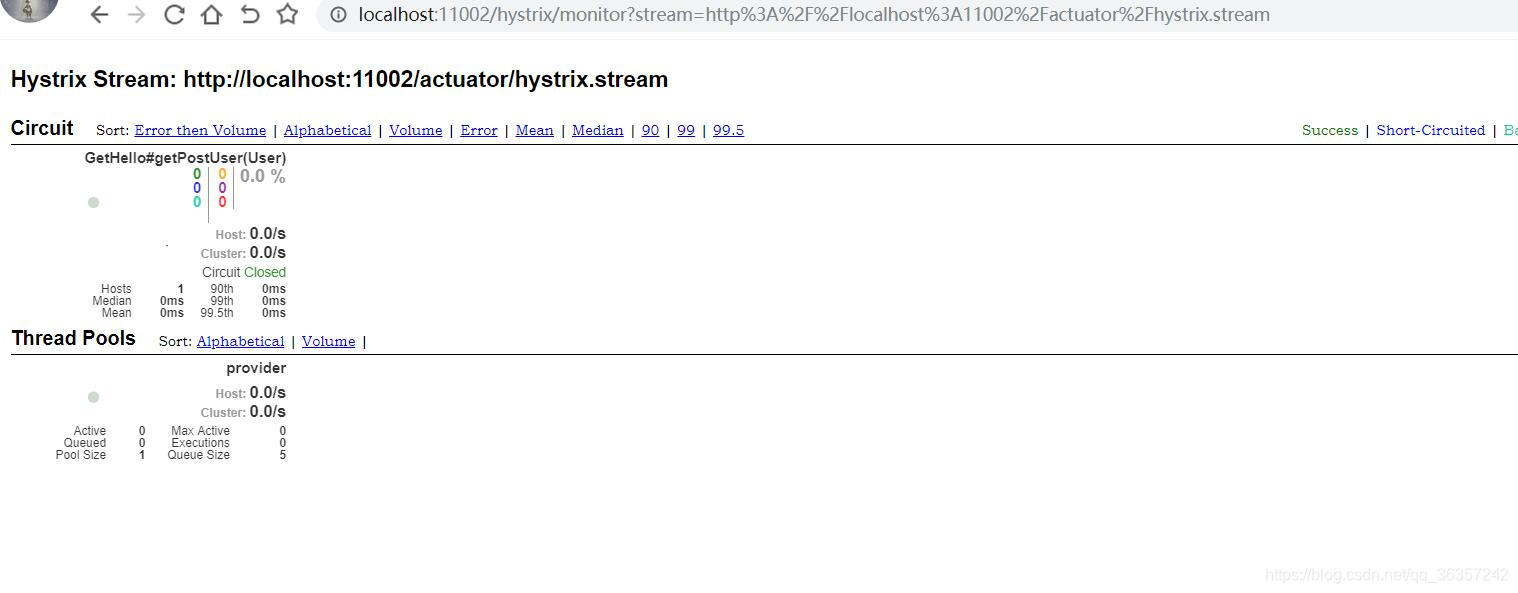
同理端口11001也是如此!
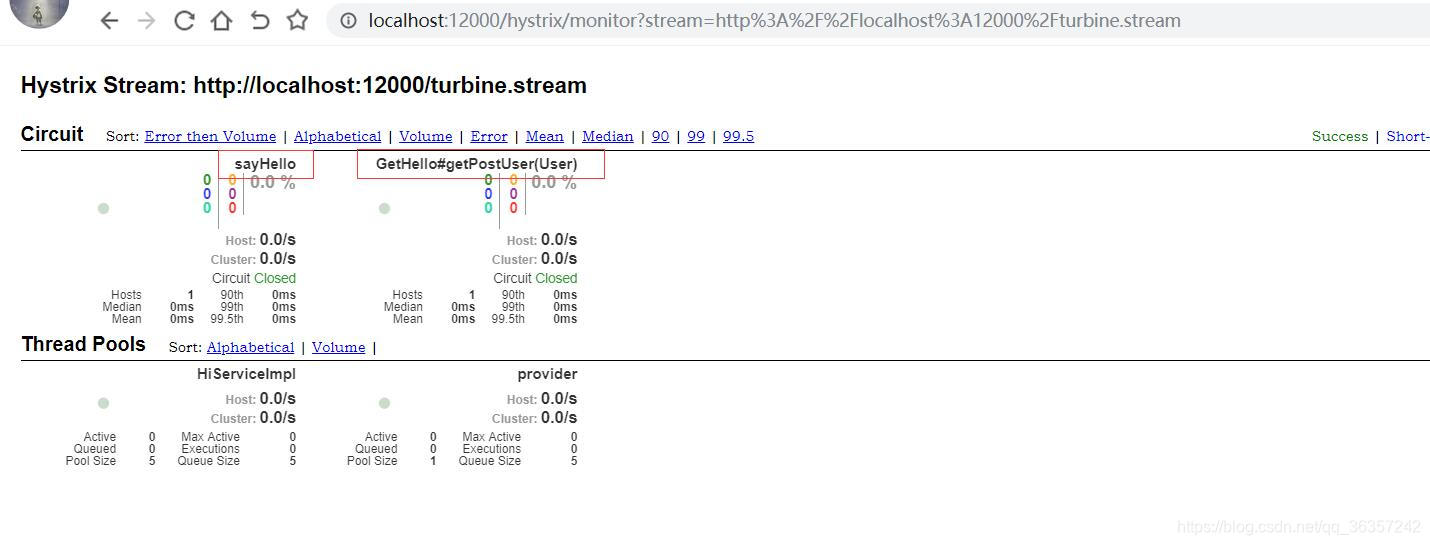
Turbine实现监控Hystrix
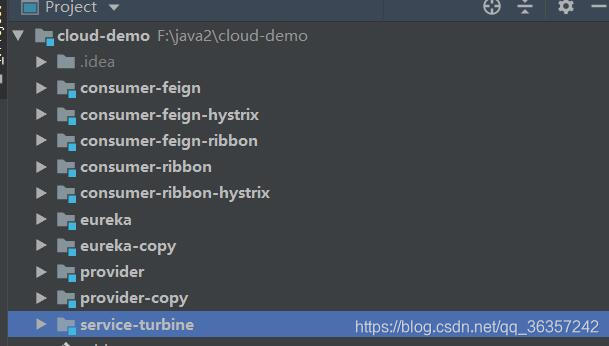
Turbine子项目搭建
继续之前的maven工程创建,这个和上边不一样的是,可以实现整体服务的监控。
项目结构
pom文件
<!--暴露各种指标-->
 <dependency>
     <groupId>org.springframework.boot</groupId>
     <artifactId>spring-boot-starter-actuator</artifactId>
</dependency>
<dependency>
     <groupId>org.springframework.cloud</groupId>
     <artifactId>spring-cloud-netflix-turbine</artifactId>
</dependency>
<dependency>
     <groupId>org.springframework.cloud</groupId>
     <artifactId>spring-cloud-netflix-hystrix-dashboard</artifactId>
</dependency>
<dependency>
     <groupId>org.springframework.cloud</groupId>
     <artifactId>spring-cloud-starter-netflix-hystrix</artifactId>
</dependency>
yml配置
server:
  port: 12000
eureka:
  client:
    service-url:
      defaultZone: http://eureka01:8800/eureka/,http://eureka02:8810/eureka/


turbine:
aggregator:
#指定聚合哪些集群,多个使用","分割,默认为default。可使用http://.../turbine.stream?cluster={clusterConfig之一}访问
clusterConfig: default
#配置Eureka中的serviceId列表,表明监控哪些服务
appConfig: consumer-ribbon-hystrix,consumer-feign-hystrix
#设置监控的表达式,通过此表达式表示要获取监控信息名称
clusterNameExpression: new String("default")
spring:
application:
name: service-turbine
main:
allow-bean-definition-overriding: true
启动类
@SpringBootApplication
@EnableTurbine
@EnableHystrixDashboard//启用Hystrix Dashboard
public class ServiceTurbineApplication {

    public static void main(String[] args) {
        SpringApplication.run(ServiceTurbineApplication.class, args);
    }

}
启动